The Planscape Treatment Effects module helps planners assess the direct effects of treatments within their project areas. With an intuitive interface, users can create and compare multiple treatment plans to evaluate their effects and identify the optimal arrangement that supports their resiliency goals.
Planscape’s treatment analysis is powered by the Forest Vegetation Simulator (FVS), a growth and yield model developed by the USDA Forest Service. FVS provides regionally specific estimates of forest conditions over time under both treated and untreated scenarios. This tool leverages the USFS TreeMap dataset within the FVS framework to simulate the effects of various fuel treatments on every forested acre in California.
For non-forested areas, the Treatment Effects tool utilizes the LANDFIRE Total Fuel Change Tool, which estimates post-treatment surface fuel characteristics to support comprehensive treatment analysis.
Once a treatment plan is finalized, Impacts generates a 20-year analysis showing direct effects at 5-year time steps (0, 5, 10, 15, and 20 years). More details on the methodology for calculating direct effects for both forested and non-forested areas can be found here.
To begin using Treatment Effects, you must first define a Planning Area—either by drawing one or by uploading a shapefile, in Explore. For detailed instructions on creating a Planning Area, refer to the Planscape User Guide section on Creating New Plans. Once your Planning Area is created, you can either run a new scenario or upload existing project areas.
To begin using Impacts, you must first define a Planning Area—either by drawing one or by uploading a shapefile, in Explore. For detailed instructions on creating a Planning Area, refer to the Planscape User Guide section on Creating New Plans. Once your Planning Area is created, you can either run a new scenario or upload existing project areas.
To create a new treatment plan, select “+ New Treatment Plan” from either:
When you create a new treatment plan, you will be prompted to Name Your Treatment Plan. Processing may take a few minutes, depending on the size of the area.
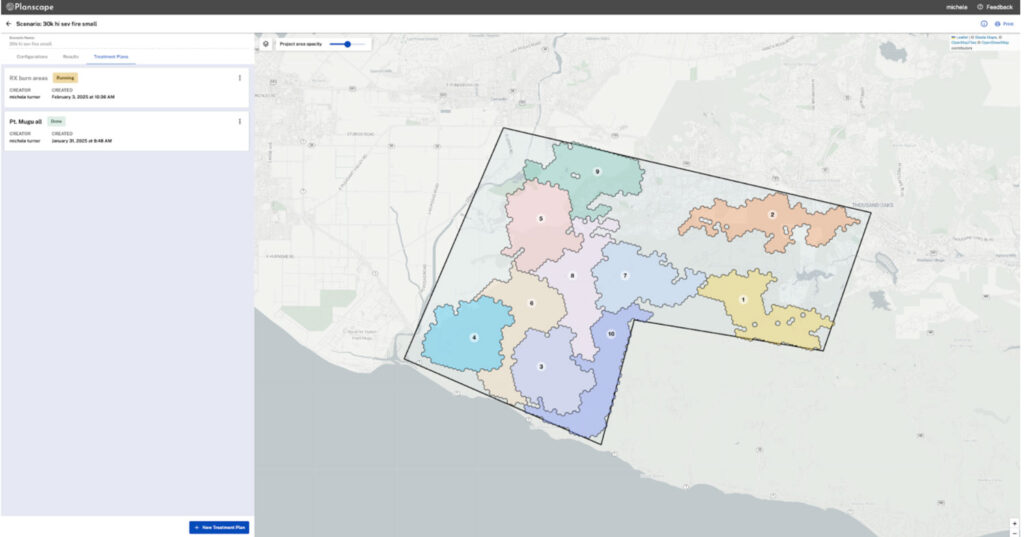
The Treatment Plans tab will show the treatment tool along with any treatment plans that are in progress or completed.
To begin using Treatment Effects, you must first define a Planning Area—either by drawing one or by uploading a shapefile, in Explore. For detailed instructions on creating a Planning Area, refer to the Planscape User Guide section on Creating New Plans. Once your Planning Area is created, you can either run a new scenario or upload existing project areas.
To begin using Treatment Effects, you must first define a Planning Area—either by drawing one or by uploading a shapefile, in Explore. For detailed instructions on creating a Planning Area, refer to the Planscape User Guide section on Creating New Plans. Once your Planning Area is created, you can either run a new scenario or upload existing project areas.
To create a new treatment plan, select “+ New Treatment Plan” from either:
When you create a new treatment plan, you will be prompted to Name Your Treatment Plan. Processing may take a few minutes, depending on the size of the area.
The Treatment Plans tab will show the treatment tool along with any treatment plans that are in progress or completed.
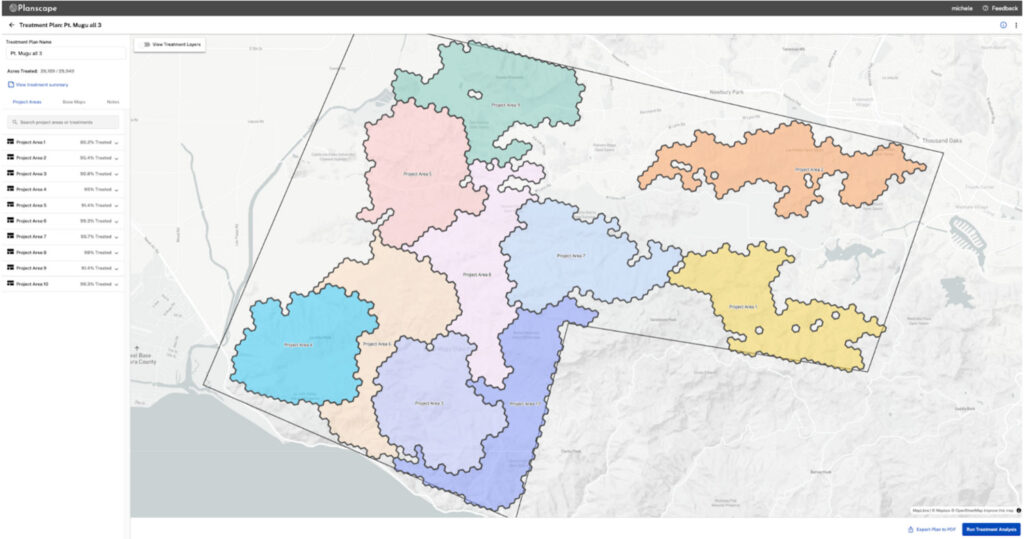
Once a treatment plan is created and named, the Treatment Plan Overview page will display the Planning Area and its associated Project Areas. This page provides an overview of all project areas and the status of treatments applied to each. It updates automatically whenever new treatments are added.
The page includes three main tabs:
Treatments are searchable – use the search box to review specific treatment prescriptions across project areas. This is especially useful for large planning areas with numerous treatments applied.
The Treatment Summary provides a breakdown of the total acreage for each treatment applied across all project areas.
Treatment plans are created by applying available treatments at the stand level. To begin:
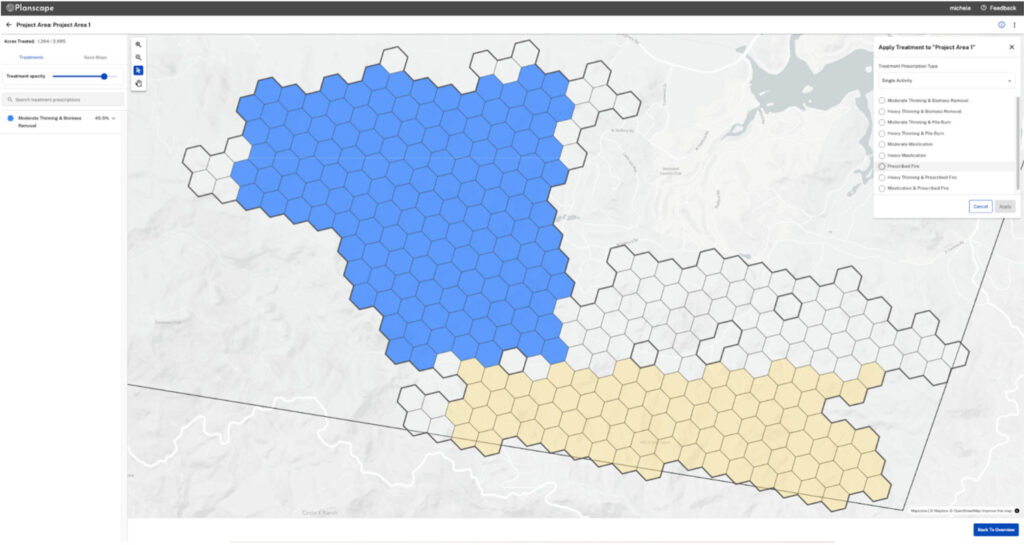
To return to the main planning window, click “Back to Overview” in the lower right-hand corner of the screen.
Treatment types were developed in cooperation with land managers to represent the most relevant treatments that are likely to be applied in forested and non-forested systems with the goal of reducing fuel loading and wildfire likelihood and severity.
Planscape Treatment KCPs used in FVS can be found here.
Thinning treatments, with the exception of mastication, are followed either by biomass removal or pile burning in the same year or prescribed fire simulated in the subsequent year of treatment.
Treatment type | Treatment details |
Moderate thinning and biomass removal |
|
Heavy thinning and biomass removal |
|
Moderate thinning and pile burn |
|
Heavy thinning and pile burn |
|
Moderate mastication |
|
Heavy mastication |
|
Prescribed fire |
|
Heavy thinning and prescribed fire |
|
Mastication and prescribed fire |
|
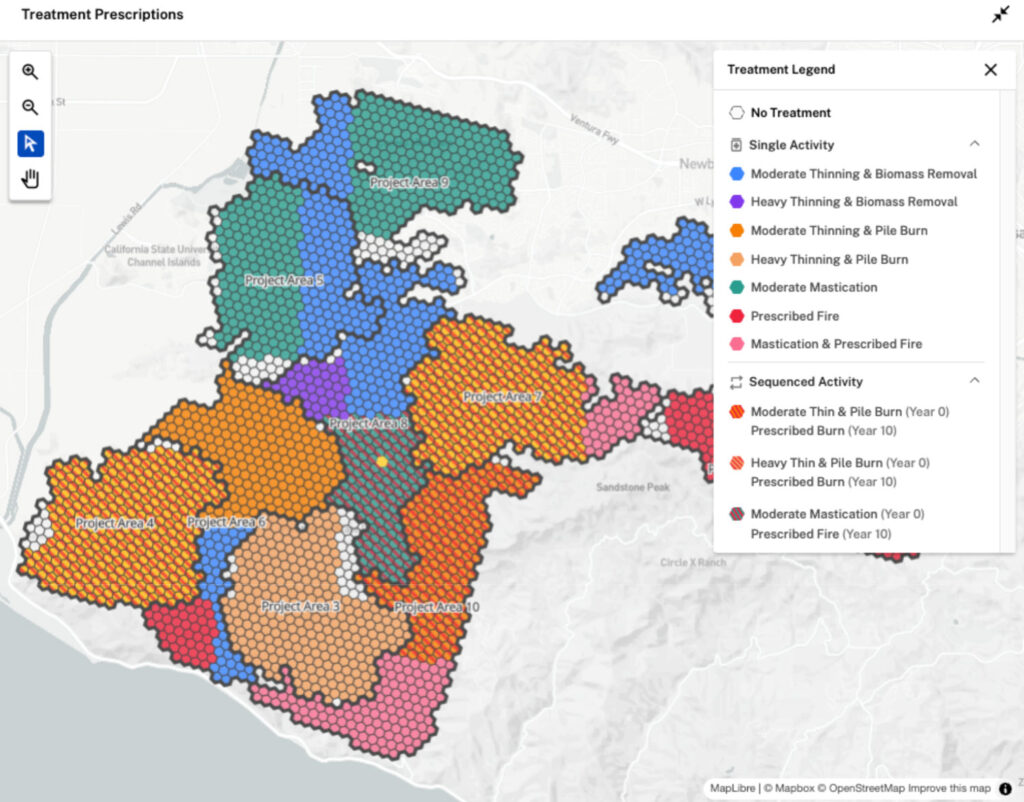
To get an overview of where treatments have been applied across all project areas, use the “View Treatment Layers” toggle. This provides a visual summary of the treatment status across the planning area.
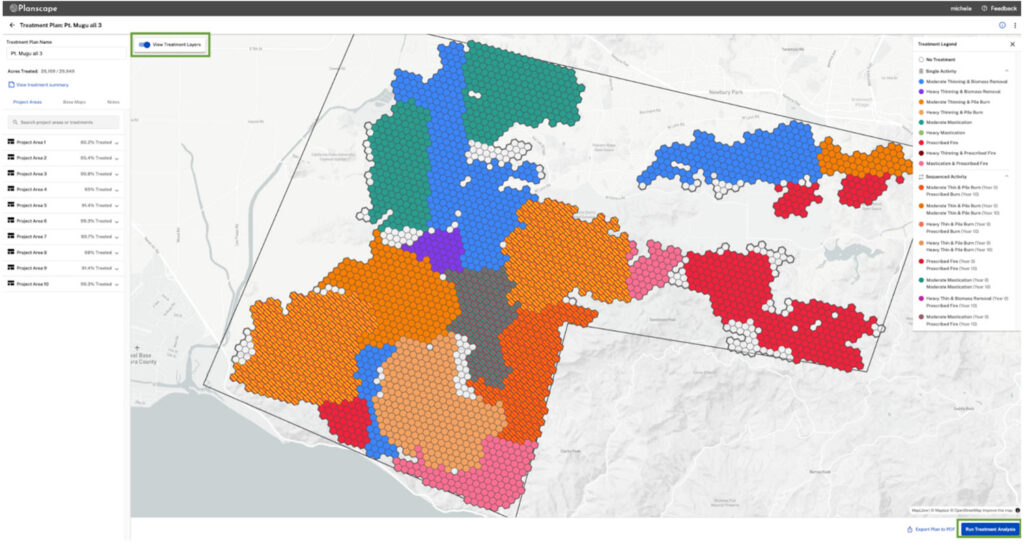
Once all treatments are applied and the plan is finalized, select “Run Treatment Analysis”.
Before running the analysis, you will be prompted to review your treatment plan to ensure all desired treatments have been applied.
The Treatment Effects model will process the treatment plan, which may take several minutes depending on the number of treatments applied. Once the analysis is complete, Planscape will send an email notification when the results are ready for review. The treatment plans status can also be viewed in the Treatment Plans tab.
The Treatment Analysis displays direct effects for both forested and non-forested areas inside of project areas. It generates a 20-year analysis of treatment plans, displaying direct effects at 5-year intervals: 0, 5, 10, 15, and 20 years.
To view your treatment analysis:
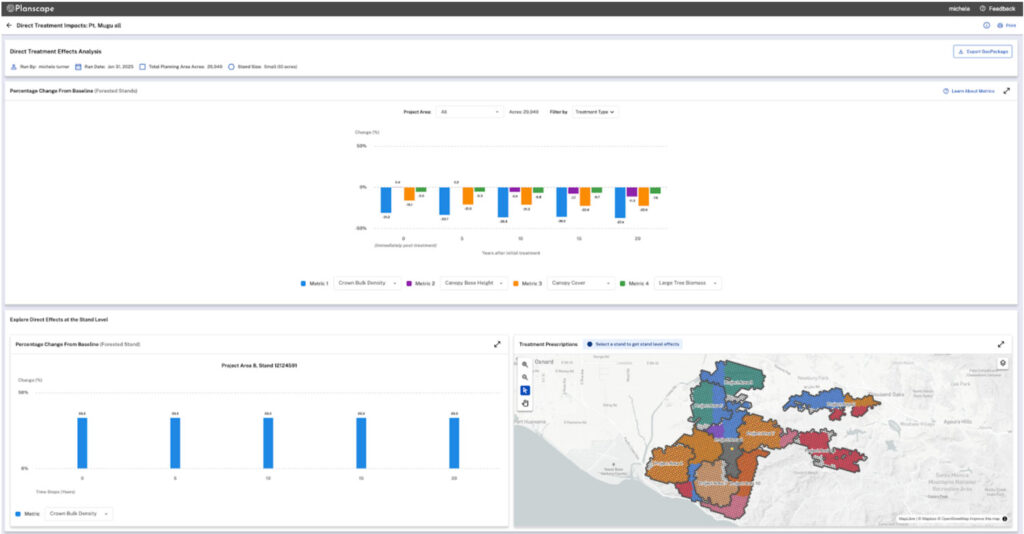
Users can download a GeoPackage of their analysis results by selecting “Export GeoPackage” in the top-right corner of the analysis.
This graph visualizes percentage changes from the baseline over a 20-year period, with data points at 5-year intervals (0, 5, 10, 15, and 20 years). Year 0 represents the immediate post-treatment condition, while subsequent time steps illustrate longer-term treatment effects. The data is derived from the Treatment Effects model using FVS and reflects direct effects outputs for forested stands. “% forested” refers to the proportion of the stand that is considered forested based on the TreeMap data product.
This section provides both a map and a graph to visualize where specific treatment prescriptions were applied and to explore stand-level direct effects on metrics relating to stand structure and composition, fuel structure and composition, and potential fire impacts (see table below). Note that visualizations show the unitless ratio between baseline and treatment values (Δ) and not absolute values of those metrics.
Once a stand is selected, this graph provides a detailed stand-level view of direct effects based on treatment type and landscape characteristics.
Forested Stands
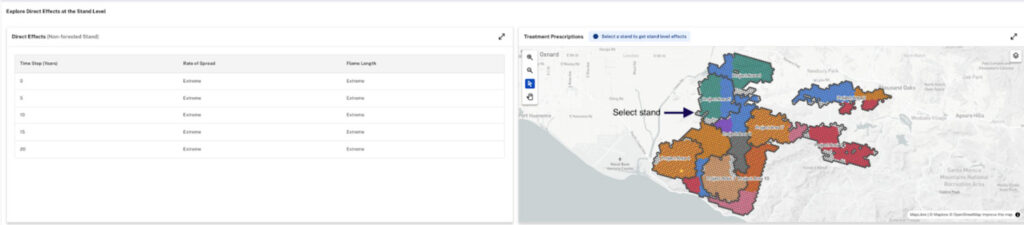
Non-Forested Stands
Instead of showing percentage change from baseline, this graph presents a table displaying:
These values represent the actual post-treatment classification of the stand at each 5-year time step, rather than a comparison to baseline conditions.
Per RMRS GTR153, spread rates and flame lengths are referred to as being very low, low, moderate, high, very high, and extreme—assuming two-thirds cured herbaceous, dry dead fuels (moisture scenario D2L2), a midflame wind speed of 5 mi/h, and zero slope. See the following table:
Adjective Class | ROS (ch/h) | FL (ft) |
Very Low | 0-2 | 0-1 |
Low | 2-5 | 1-4 |
Moderate | 5-20 | 4-8 |
High | 20-50 | 8-12 |
Very High | 50-150 | 12-25 |
Extreme | > 150 | > 25 |
Table: RMRS GTR153
Metric | Description |
Crown Bulk Density | the weight of the crown per unit volume |
Canopy Base Height | the average height above the ground where the tree crowns begin. |
Canopy Cover | the percentage of the ground covered by the vertical projection of the tree crowns. |
Large Tree Biomass | the amount of woody material (weight or volume) contained in trees above a certain size threshold. This threshold can vary depending on the forest type and management objectives |
Merchantable Biomass | the weight of the stem and branches of a tree that can be used for lumber or pulp. |
Non-merchantable Biomass | the weight of the other parts of a tree, such as the leaves, needles, and roots. |
Mortality | the number of trees that die in a stand. |
Potential Smoke | the amount of smoke that could be produced by a fire in a stand. |
Probability of Torching | the likelihood that a tree crown will ignite and burn intensely. Canopy Base Height, Canopy Bulk Density, Fuel Moisture and Fire Intensity all impact the output of the probability of torching. |
Quadratic Mean Diameter | the average diameter of the trees in a stand, calculated by taking the square root of the average of the squared diameters of the trees. |
Stand Density Index | a measure of the number of trees per acre. |
Total Height | the height of the tallest tree in a stand. |
Total Flame Severity | a measure of the intensity of a fire in a stand. |
Total Carbon | the amount of carbon stored in a stand. |
All metrics for forested stands are calculated in FVS at each five-year timestep using FVS default equations specific to the particular FVS variant being modeled.
For non-forested areas, the Treatment Effects tool provides outputs for Rate of Spread (ROS) and Flame Length, which differ from the metrics used for forested areas. These results are generated using the LANDFIRE Total Fuel Change Tool (LFTFCT) to assess fuel treatment impacts.
The LFTFCT applies disturbance codes to determine changes in the Fire Behavior Fuel Model 40 (FM40). The modified FM40 values are then used to classify and display the Flame Length and Rate of Spread adjective classes for non-forested stands. The outputs for non-forested areas are based on the standard fire behavior surface fuel models (Scott and Burgan 2005).
Additional information can be found on the Vegetation and Fuels Modeling Methodology page.
Note: Non-burnable fuel models will not display Flame Length or Rate of Spread outputs.