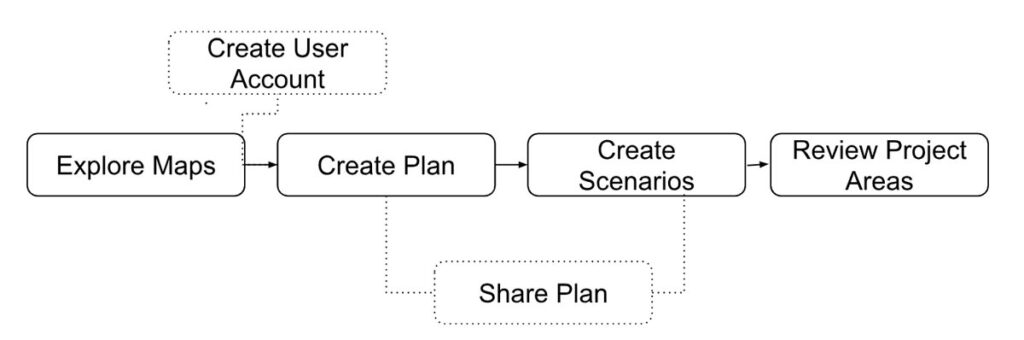
Planscape is a wildfire resilience planning support and collaboration tool to help you plan and prioritize landscape fire resilience treatments by leveraging the latest data and climate models.
Understanding the ecosystems of very large wilderness landscapes is challenging. Planning where to place treatments on those large landscapes takes a tremendous amount of time, staff and money. Even just finding accurate data to understand the state of the land – where have there been fires in the last 10 years, what’s the mean FRID, how many acres comprise endangered species territory – can be very complex. The goal of Planscape is to provide landscape-scale planners:
For landscape analysis backend, Planscape uses the ForSys planning tool, developed by the USDA Forest Service.
Using Planscape, a landscape planner can determine the most effective areas to plan treatments on a given landscape, based on their inputs and criteria. The tool makes it easy to run multiple scenarios with a variety of inputs to determine the most effective treatment areas.
Planscape is a free, open source web based software application, built on tools and data provided by state and federal governments.
This version of Planscape gives you an opportunity to explore datasets on maps and identify optimal treatment areas..
At a high level, you will use Planscape to perform the following tasks:
The Map Viewer provides interactive visualization tools to explore datasets relevant to scenario planning. It features two primary tabs for data interaction: Data Layers and Base Layers.
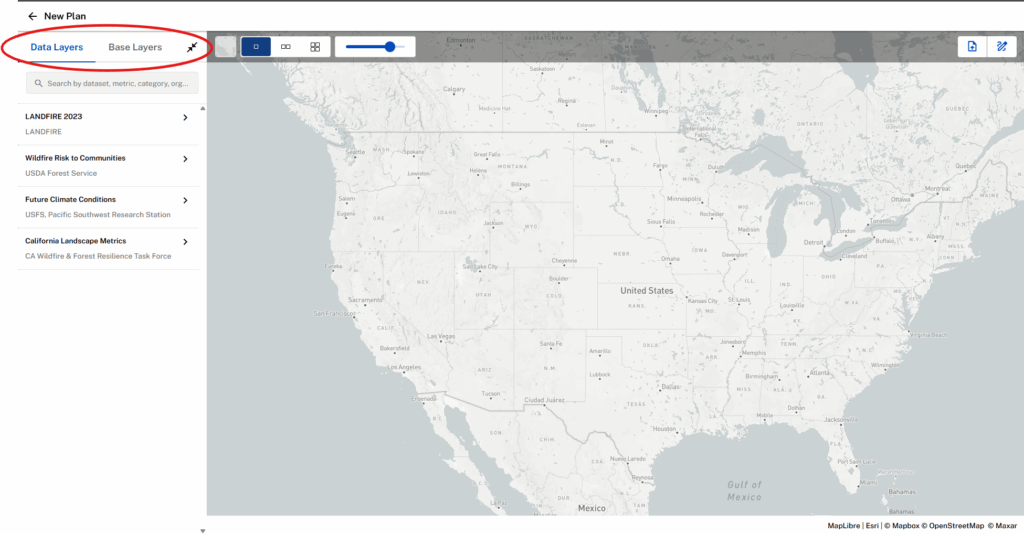
Data Layers are thematic datasets that vary in spatial extent. These layers represent dynamic data used in scenario planning workflows.
Base Layers are vector datasets that provide context for planning decisions. These include:
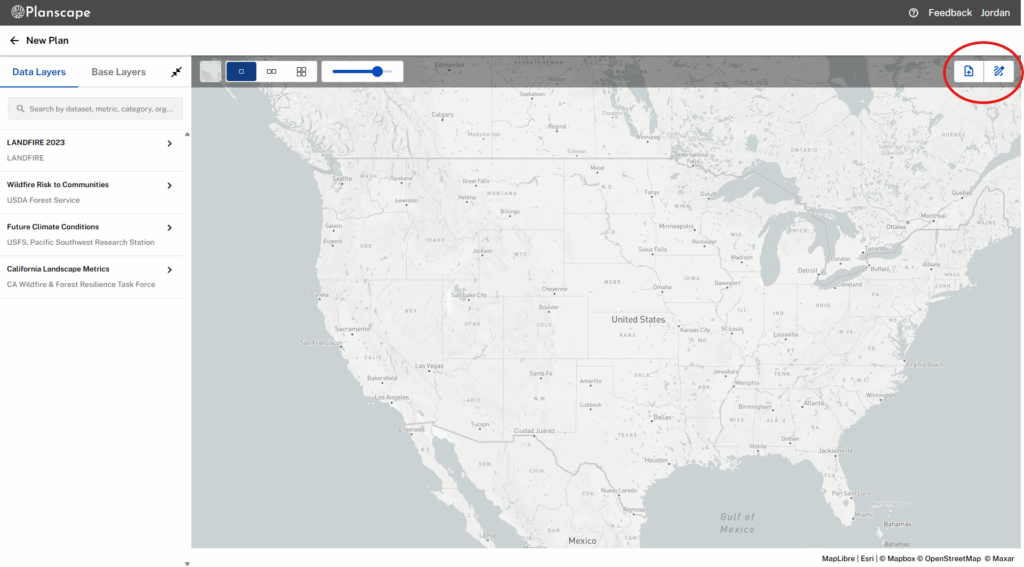
You can define your planning area using tools located on the far-right of the control bar:
1. Upload a shapefile of your planning area.
2. Draw directly on the map.
When you launch Planscape for the first time using the web link app.planscape.com, Planscape considers you as a guest user.
As a guest user, you can:
*Accessible only via direct links.
When you create a Planscape account, you will have access to the complete capabilities of the application.
As a logged in user with an user account, you can:
A Planscape user account is required for you to use the treatment area planning capabilities.
To create a user account:
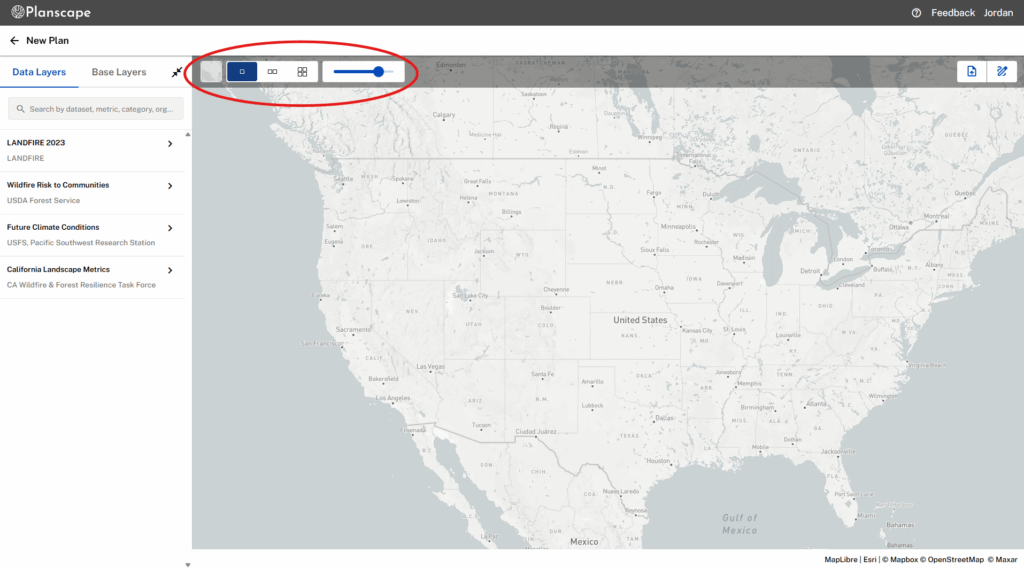
1. You can use the Plus to zoom in or the minus sign to zoom out of a map.
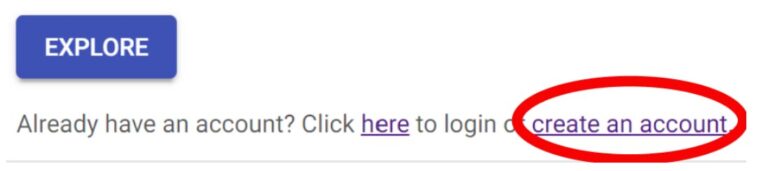
You can also click on Sign In on the menu bar.
2. In the Create your account page, enter your First name, Last name, a valid email address, enter a password, and repeat the same password in the Confirm password field.
Note: You must make sure the passwords in Create password and Confirm password fields match to see the blue Create Account button become visible.
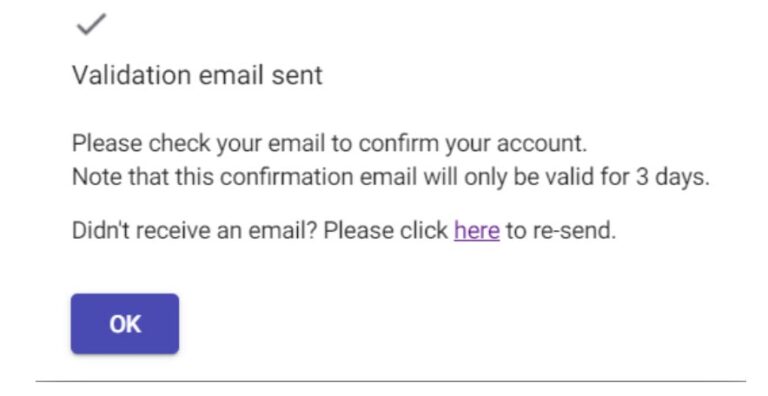
3. Click Create Account. This action sends an email to the email ID you have added to the account. You will see the message below:
4. Check your email inbox. You should see an email similar to the one below:
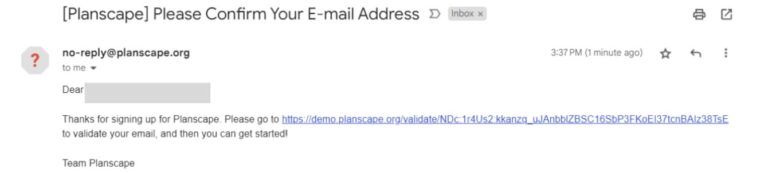
Note: if you don’t receive a validation email, please check your spam folder.
After creating your user account, you can edit your information or deactivate your user account at any time.
To edit your user personal information:
Helping you determine the best locations for land treatment in your area of interest is the core capability of Planscape. This version of Planscape will help you to identify the best areas to treat depending on your requirements. At this time Planscape does not provide recommended treatment types. Recommended treatment type capability will be coming in future releases.
The planning capabilities of Planscape are built on top of ForSys, which is an open source tool developed by the USDA Forest Service. ForSys has been in use for years by the Forest Service to determine the most optimal treatment areas for any given project. Our goal with Planscape is to simplify the use of ForSys, and make it easier for people to get started with planning.
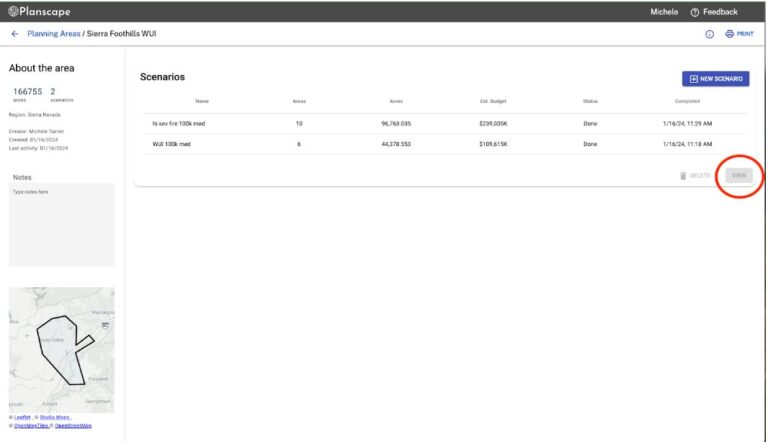
You can create multiple scenarios for each planning area. Each scenario can only have one treatment goal, and the variables per scenario are also very likely to change.
To create a new scenario:
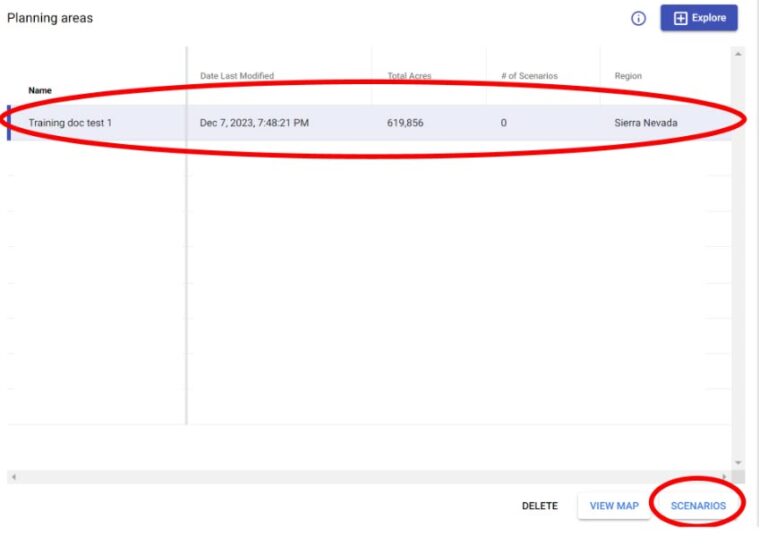
1. On the Planning areas page, click one of your plans that you want to create a scenario for and click Scenarios from the lower right corner of the screen. You can also double-click on the planning area to get to the scenarios.
2. Click New Scenario. The Planning Areas / <your plan name> / New Scenario page opens and shows the map view panel your planning area.
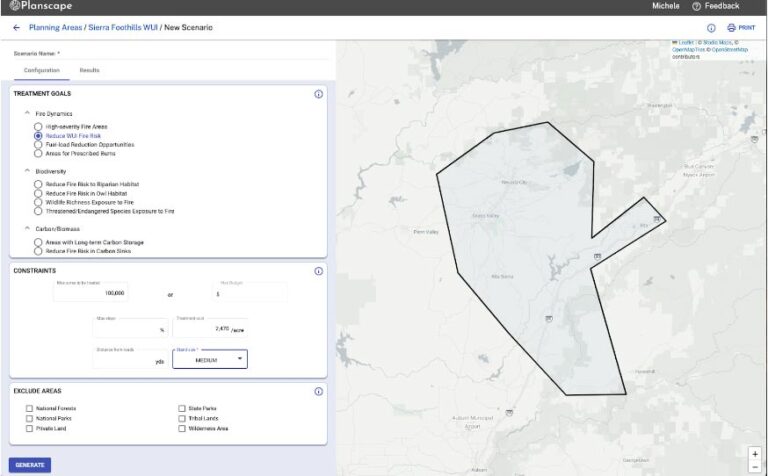
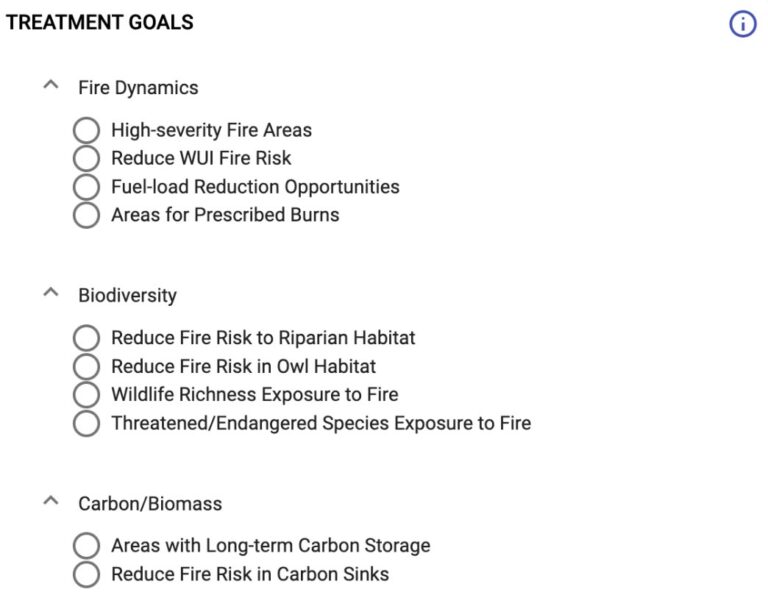
In the left pane, enter a name for your scenario and select options for the following based on your treatment goals:
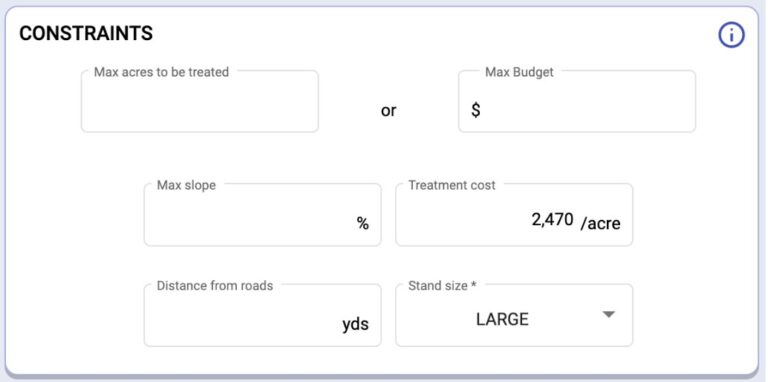
Note: The max areas to be treated must be between 20% and 80% of your total planning area acreage.
Note: The stand sizes represent the number of acres per stand. Small stand size equates to 10 acres/stand, Medium stand size is 100 acres/stand, and Large equates to 500 acres/stand.
4. Click Generate. This will give you the results of your query on the Results page.
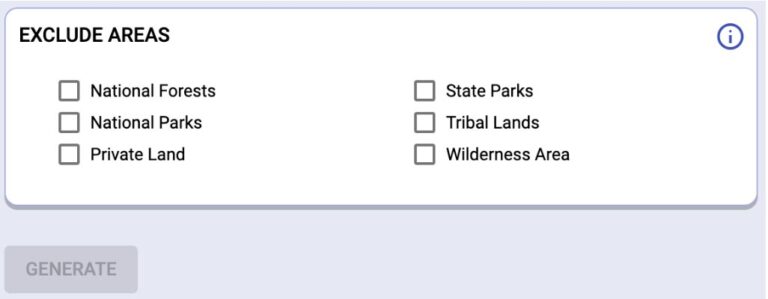
Note: if your scenario fails, it is likely because there are too many constraints applied. Constraints reduce the amount of available land on which the project areas can be identified. To reduce failure events, ensure that you set the maximum available acreage, limit constraints and exclusion areas. If your scenario continues to fail, eliminate all constraints and then add them back in iteratively. It can be challenging to identify which constraint is causing the failure. We recommend running all biodiversity questions, and the “Reduce Fire Risk to the WUI” question with ‘small’ stand size selected.
You can save the metrics output as a .csv file for input into Excel or Google Sheets for further analysis. You can also print or save the map as a shape file.
To create another scenario:
1. Click either on the back arrow button in the header, or the name of your plan. This will take you back to the New Scenario page. You can see the list of all the scenarios you have created on this page.

2. Similar to the Plan home page, you can either double click on a scenario or click the view button to bring that scenario back into view. If you have scenarios that have either failed or that you don’t need, you can also delete them from this page.
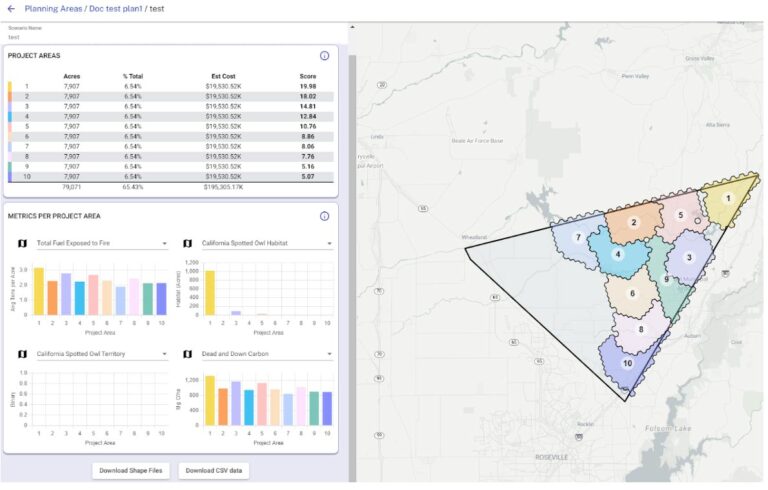
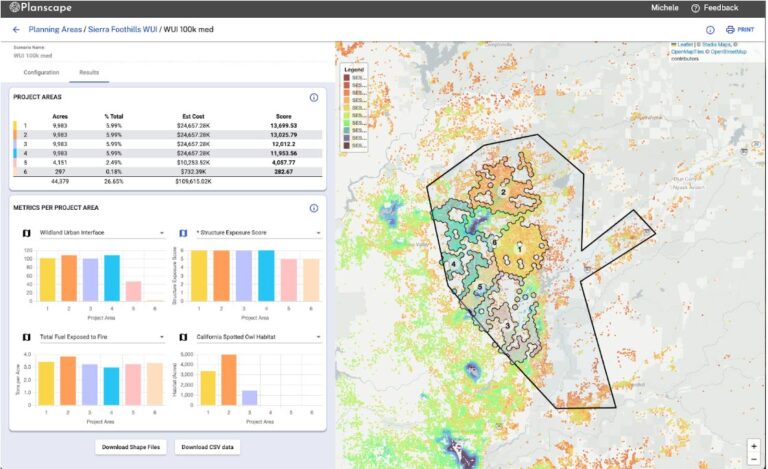
In Figure 18 above, the project score is calculated for each specific treatment goal question . The score is the only Planscape results that determines the ranked order of project areas. If there are 10 project areas for one scenario, project area 1 will have the highest score and project area 10 will have the lowest score. The score reflects how well stands in a project area collectively meet the treatment goal criteria for the given configuration relative to other project areas for the same scenario.
For example, if the treatment goal is “High Severity Fire Areas”, then the output of this treatment goal identifies areas that are currently at highest risk for high severity fire. Project Area 1 has the highest score and indicates that this is the area that is best for treating the places with high severity fire given constraints. However, the score does not directly tell the user anything about what those treatments will accomplish. It is not saying this is the project area where treatments will reduce the probability of high severity fire.
The score calculation is based on the primary variables for each question, and how ForSys calculates the stand value for each of those variables by looking at the spatial data related to that stand. It’s important to understand what has gone into the formula to derive these outputs. For more information, see How ForSys Is Used to Determine Project Area Prioritization. For a single variable question, such as determining high severity fire areas, each treated stand in a project area is scored by ForSys on the probability of high severity fire, and the treated stands are summed to create a score for each project area. Then each project area is ranked by sum.
For queries with multiple variables, Planscape takes the output scale for each variable (that may be a combination of high severity fire and fuel load layers), normalizes those outputs, weights them equally, and then treats them as one value for that stand. For example, if variable A has values of 0.5 (numbers ranging from 0 to 1) and variable B has a value of 60 (numbers ranging from 0 to 100), Planscape normalizes them to be in the same range, so variable B now ranges from 0 to 1. The resulting value for A stays the same at .5 and variable B now has a value of .6, with a combined weighted value of 1.1 (the sum of 0.5 and 0.6). The combined input value of 1.1 is then used in ForSys for that stand, which is then summed with all stands for that project area. The project areas are then stack ranked, providing the score.
Different treatment goals will generate different project areas within a planning area. For example, determining where to best treat the land to prevent high severity fire may have very different results from determining where to best treat to protect spotted owl habitat. This is why it’s important to run multiple different scenarios per planning area to understand the optimal treatment areas for different needs. Also note that the treatment goal questions are different based on the region in which you are doing your planning, based on the ecology of regions. Some treatment goals may not be applicable to all regions.
Total available acreage is another important variable in determining project areas. If you run a budget constrained scenario, it’s likely that you will have fewer project areas. For larger available acreage, it’s likely that more project areas will be identified.
Stand size has a high impact on the project areas. Selecting a small stand size will provide the most granular and accurate output, however for large planning areas (>50K acres) this can take a long time to run. We recommend performing the initial scenario runs with medium or large stand sizes to test the outputs, and when the variables are set, then do the run selecting the small stand size. Small stand size runs of >100K acres can take 20-30 minutes. You will note that the project area priorities will be different at different stand sizes – this is as expected, as the tool is pulling much more granular information with smaller stand sizes, which changes the output.
The graphs on the Results page in Figure 17 provide information on the secondary metrics in the scenario. The default shows four charts, however by selecting the down-arrow on the top right of the chart, additional metrics can be selected. Each of these metrics comes from the Regional Resource Kit, and more information on those metrics can be found in the data dictionaries, described above. The X-axis shows the project area, while the Y-axis provides the measurement data related to the metric. These charts can be useful in reviewing a scenario, as it may show that a scenario run to identify optimal areas to prevent high severity fire may be contraindicated for spotted owls or other endangered species.
All of the metrics output is available in a .csv file for import into other tools. A shapefile of the project areas can also be generated.
There are two ways to share a Planning area.
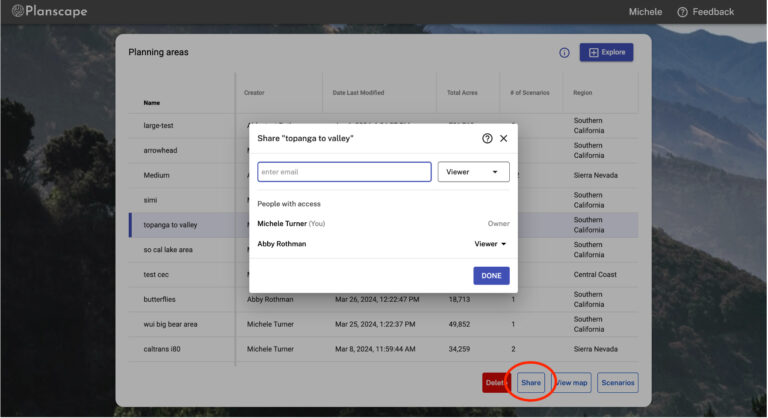
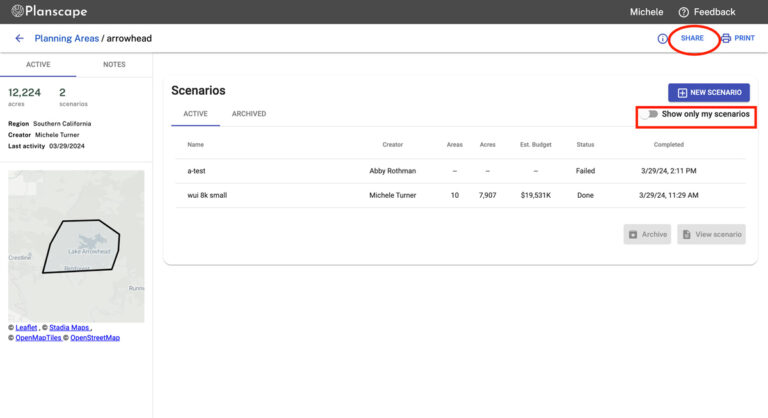
Once a plan has been shared, you will be able to see plans that you have been invited to on your Planning Areas page. When you go into that planning area, you will see any scenarios that have been created by your plan collaborators. Note in the image above that you will be able to use the toggle to show only your scenarios, or all scenarios.
Likewise on the Planning Areas page, if you click on the “Creator” title at the top of that column, it will toggle between showing most recent plans, or plans listed by the creator in alphabetical order.
Lorem ipsum dolor sit amet, consectetur adipiscing elit. Ut elit tellus, luctus nec ullamcorper mattis, pulvinar dapibus leo.